In the Spring of 2007 I took a course called “Paul Revere: Tough as Nails” (Materials Science course plus History of Technology course), and the final project my team and I chose was to design lesson plans for teaching non-Newtonian fluid dynamics and significance to elementary, high school, and college students. This post outlines the lesson plan ideas for a high school school audience. To see the main project overview go here.
High School Handout
Stress
Stress is a measure of how much force is applied to an object. There are two fundamentally different ways something can be stressed. An object can:
- Be pulled apart or pushed together. This is referred to as tensile stress and compressive stress, respectively. For example, the rope in a game of tug-of-war is under tensile stress, whereas a building’s foundation is compressively stressed.
- Have two parallel sides pushed or twisted in opposite directions. This is called shear stress and torsional stress. A good example of shearing is a bolt holding two metal plates together: when the plates try to move, the two ends of the bolt stay parallel but are pushed in opposite directions. Whenever your car accelerates, its engine puts the axle under torsional stress, because one end of the axle is trying to move while the other is trying to stay still.
Tensile and compressive stresses can both be referred to as engineering stress. Engineering stress is represented by the Greek letter σ (sigma), and is defined as
1 σ = F/A0Engineering Stress
Engineering stress is always in units of force (F) per area (A0), which is pressure. The SI unit of pressure is the Pascal, equal to one Newton per square meter and abbreviated as Pa. The area used in calculating tensile and compressive stress is always the cross-sectional area perpendicular to the applied force, while for shear stress, the area is equal to the size of the faces that are being moved past each other.
We can reuse the tug-of-war example to demonstrate an engineering stress calculation. If the rope’s radius is 1 cm – giving it an area of (1 cm)2*π = π cm2 – and a person on each end is pulling with a force of 330N[[1]](file:///C:/Users/Marcotuts/Documents/Classes/2nd%20Semester/MatSci/Project%203/All%20Together%20Now.docx#_ftn1), then the total stress on the rope will be 330N/(π cm2) = 1.05 * 106 Pa = 1.05 MPa. Because stress is dependent on the cross-sectional area of the object, if the rope’s area were to double, the stress on it would be cut in half.
In general, shear and torsional stresses are both referred to as shear stress, because at the molecular level the same deformations are occurring. Shear stress is written as τ (tau) and is also measured in units of pressure. Though on the surface τ and σ seem to be defined the same way, the difference is in the area, A0. Whereas for engineering stress A0 is the cross-sectional area perpendicular to the applied force, for shear stress A0 is equal to the area of the two surfaces that are being sheared past each other. For shear stress, A0 is parallel to the force.
2 τ = F/A0Shear Stress
Strain
Strain is a measure of how much something is deformed as a result of stress. Logically, when something is pulled apart it becomes longer and when it is forced together it becomes shorter
Like stress, there are two main types of strain. For engineering stresses, strain is characterized by the letter ε (epsilon) and given the equation
3 ε = (li – l0)/l0 = Δl/l0Engineering Strain
in which l0 refers to the initial length of the object and Δl refers to the change in length. Because an object’s length is always positive, the sign of the strain is entirely dependent on Δl: for tensile stress the object’s length will increase, yielding a positive strain, whereas an object under compression will have a negative strain.
 Figure 1. Engineering Strain
When an object is subject to shear stress, the resulting strain is called γ (gamma) and is defined as
4 γ = tanθ Shear Strain
where θ is the object’s deviation from square or, in the case of torsional stresses, the amount that one face has rotated past the other (see figures 1 and 2).
Note that, just as both types of stress have the same units (pressure), both types of strain are unitless.


Figure 2. Shear Strain Figure 3. Torsional Strain
Stress/Strain Graphs
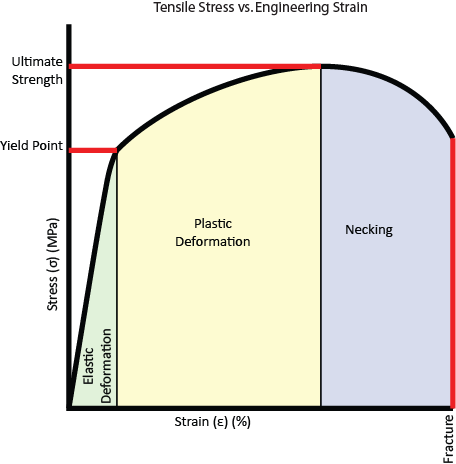
 Figure 4. Tensile Stress/Strain Curve
Engineering stress and strain are usually measured using a machine that strains the material at a fixed linear rate and records the stress. These values are then plotted on a graph – with strain in percent elongation along the x-axis and stress, typically in MPa, along the y-axis. Figure 4 shows a typical tensile stress/strain curve. There are quite a few things of note that can be gleaned from a stress/strain curve.
For small strains, the curve is actually linear—pulling twice as hard will make the change in length twice as large. The change in the object in this region is referred to as elastic, because when the stress is removed the object returns to its original length. The slope of this portion is called the modulus of elasticity, or Young’s Modulus, and is denoted by the letter E. The units of the modulus of elasticity are Pascals.
After the material strains a certain amount, it reaches its yield point. At this point the slope of the curve decreases drastically and ceases being linear, and deformations to the object become permanent. This is called plastic deformation.
If the strain increases even more, eventually the object will neck. During elastic and plastic deformation the entire object’s cross-sectional area decreases slightly (as can be seen in Figure 1), but at the onset of necking the weakest part of the material suddenly becomes noticeably thinner (forming a “neck”). Because the smallest cross-sectional area of the object is suddenly smaller, it takes less force to finish pulling the object apart, so engineering stress decreases when necking occurs.
 Figure 5. Necking and Fracture
Newtonian Fluids
Fluids cannot be tested for their stress/strain characteristics in the way that solids can, because fluids flow to take the shape of their container. You can’t, for example, perform a tensile test on water. However, liquids exhibit other behaviors that can be tested. For example, a common experiment to perform on fluids is a stress/rate-of-strain measurement. Whereas in a solid the stress increases with the amount of strain, in a liquid the stress increases with the rate of strain. To put it more simply, pushing harder will deform a solid more while it will deform a liquid faster. A typical stress/rate-of-strain graph is given in Figure 5. The slope of the graph is referred to as the viscosity of the fluid. A fluid with a greater viscosity will require a greater amount of stress to have the same rate of strain: for example, maple syrup has high viscosity whereas water has low viscosity. For the two liquids to flow at the same rate the syrup would have to be pushed much harder.
Viscosity is measured in Pascal-seconds, because rate of strain is in units of Hertz (1/seconds) and viscosity is stress over strain. The symbol for viscosity is η (the Greek letter eta).


Figure 6 . Newtonian (Left) and Non-Newtonian (Right) Fluid Behavior**. **
If the stress/rate-of-strain graph is linear, as in Figure 5, the fluid is Newtonian. If the stress is doubled in a Newtonian fluid, the rate of strain doubles as well: if you push twice as hard on water you will move twice as fast through it. The viscosity is constant no matter what the stress or rate of strain is.
There are some fluids, however, that do not exhibit this same behavior; these are aptly named non-Newtonian fluids, and there are two main types. A dilatant’s viscosity increases with its rate of strain, meaning that the harder it is pushed on the thicker it gets. A pseudoplastic’s viscosity decreases with the strain rate, meaning that it is thick and viscous unless stress is applied.
An example of a non-Newtonian fluid is a suspension of cornstarch in water (commonly called Oobleck). When sitting, it appears to be a liquid, and it pours like a liquid. However, if it is struck or squeezed or stress is applied in some other fashion, the oobleck solidifies almost instantaneously. At high stresses the viscosity is so high that the oobleck will even fracture.